Table of Contents
Dashboard Limitations: The Hidden Reason Your Data Isn’t Driving Action
Introduction:
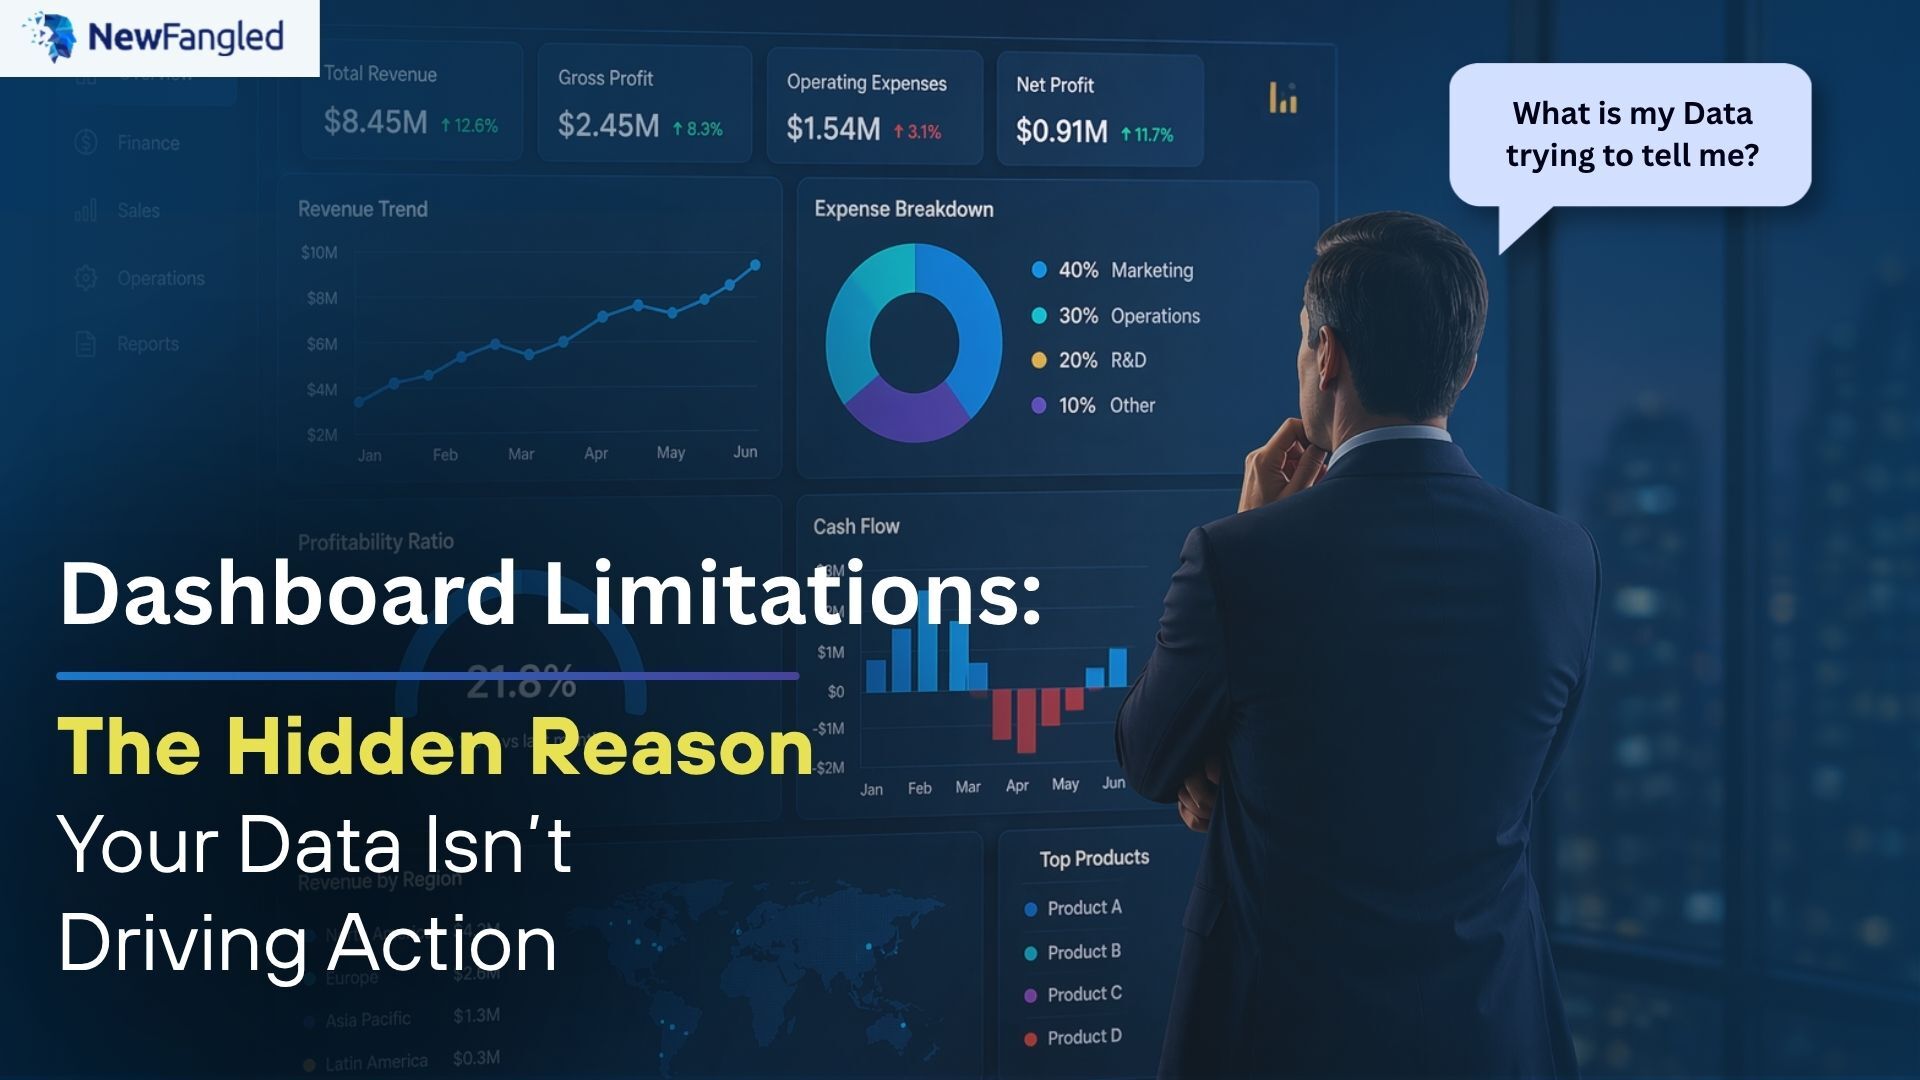
Your dashboard might look great, but is it helping anyone move faster? Dashboards have become the standard way for businesses to keep track of performance. They show trends in revenue, operational metrics, customer insights, and KPIs in clear, easy-to-read ways. Everything looks fine on the surface. But then something that happens all the time happens. A leader looks at the dashboard and says, “What should we do next?” And the system doesn’t know. This is the dashboard limitations.
Dashboards solve visibility. Businesses need decisions.
Dashboards Show Data, Not Decisions : Which is the main Dashboard Limitations
Dashboards are designed to answer one question: What is happening?
They aggregate data, visualize trends, and track performance indicators. This is useful—but incomplete. A declining revenue chart shows a problem, but not the cause. A KPI turning red signals risk, but not the action required. The burden of interpretation falls on the user. In most organizations, this creates a chain:
- Data is visualized
- Analysts interpret it
- Leaders wait for insights
- Decisions are delayed
This is one of the most critical dashboard reporting problems they inform, but they do not guide.
The 4 Levels of Data Maturity
To understand the limitations of dashboards, it helps to look at how organizations use data. Most enterprises operate across four levels:
- Data : Raw numbers collected from systems.
- Dashboards : Visualization of data through charts and KPIs.
- Insights : Interpretation of patterns and trends.
- Decisions : Clear actions based on insights.
The problem? Most organizations stop at dashboards. But value is not created at the visualization level. Value is created at the decision level.
Too Much Data Creates Confusion: Another Dashboard Limitations
In an attempt to provide more visibility, dashboards often become overloaded. More charts. More metrics. More filters. Instead of clarity, this creates confusion. A single dashboard may include:
- Revenue trends
- Regional breakdowns
- Product performance
- Customer segments
Each element is useful on its own, but together they overwhelm the user. The key question remains unanswered: “What matters right now?”
This is a critical aspect of dashboard limitations more data does not automatically lead to better decisions.
Dashboards Are Passive Systems
Dashboards rely on user action. Someone has to log in, navigate, and interpret the data. If no one checks the dashboard, nothing happens. A dashboard that requires someone to check it is already too late. This passive nature creates delays between data and action. Critical changes may go unnoticed until it is too late to respond effectively. Modern enterprises cannot afford this delay. They need systems that are proactive, not reactive.
The Hidden Cost of Dashboard Dependency
The cost of dashboards is not in their implementation, it is in their limitations. When businesses rely on dashboards:
- Insights are delayed
- Decisions take longer
- Opportunities are missed
- Risks are identified too late
A delayed insight is not a data issue, it is a business risk. For example, if a pricing issue affects revenue today but is only visible in tomorrow’s dashboard, the organization loses a full day of response time. At scale, these delays compound into significant operational and financial impact.
Delayed Insights Limit Decision-Making causing Dashboard Limitations
Most business intelligence dashboards operate on scheduled updates. Data refresh cycles may be:
- Daily
- Weekly
- Periodic
But business environments are dynamic. Market conditions change in real time. Customer behavior shifts instantly. Operational issues emerge without warning. If insights are delayed, decisions are delayed.
This gap between data and action is where organizations lose their competitive edge.
What Businesses Actually Need: Actionable Intelligence
What should you use instead of dashboards if they aren’t enough? Companies need more than just visibility; they need actionable insights and direction. This includes:
- Alerts in real time when important metrics change
- Finding the root cause of something to figure out why it happened
- Suggestions for what to do next
- Answers in plain language that make it easier to make decisions
Instead of saying, “What’s going on?”
The system should say, “What should we do?”
This is the change from dashboards to intelligence.
Dashboards Limitations vs Decision Intelligence
| Feature | Dashboards | Decision Intelligence |
| Role | Visualize data | Drive actions |
| Speed | Reactive | Proactive |
| Output | Charts | Recommendations |
| Dependency | High (analysts) | Low (systems) |
| Insight Delivery | On request | Continuous |
Real Enterprise Use Cases: From Dashboard Limitations to Decision Intelligence with VADY
Use Case 1: Revenue Drop Without Clear Action
Sales managers in a lot of companies use dashboards to keep an eye on how well their sales are doing. The dashboard shows a decline through charts and KPIs when it happens. The issue isn’t seeing it; it’s doing something about it. The dashboard shows a drop in regional revenue. During a review, the team sees it. Now we need to figure out why. We ask analysts to break down the data. There are a number of reports that look at how well a product sells, how much it costs, and what customers are buying.
It may take days for this to happen. The business has already lost a lot of time to respond by the time the root cause is found.
This whole process changes with VADY.
VADY doesn’t just show the drop; it also finds out why it happened in real time. It looks at patterns in data about prices, demand, and supply to find the problem. Then, the system makes a suggestion, like changing prices, moving inventory around, or focusing on a certain group.
Outcome:
- Immediate root-cause identification
- Faster corrective actions
- Reduced revenue loss
The shift is from “What happened?” to “What should we do now?”
Use Case 2: Inventory Imbalance and Missed Opportunities
Operations teams often use dashboards to track inventory levels across locations. While these dashboards provide visibility, they do not guide decisions. For example, one warehouse may show excess inventory, while another faces shortages. The dashboard highlights both but does not connect them. The team must manually analyze:
- Demand patterns
- Supply chain data
- Logistics constraints
This creates delays and inefficiencies. As a result, businesses face:
- Stockouts in high-demand areas
- Overstocking in low-demand regions
- Increased carrying costs
With VADY, inventory management becomes proactive.
The system continuously monitors demand and supply across locations. When an imbalance occurs, it identifies the optimal action such as redistributing inventory between warehouses or adjusting procurement plans. Instead of waiting for manual intervention, VADY enables real-time decisions.
Outcome:
- Optimized inventory allocation
- Reduced stockouts and overstocking
- Improved operational efficiency
The shift is from visibility to coordinated action.
Use Case 3: Financial Performance Monitoring Without Delays
Finance teams rely heavily on dashboards for tracking performance metrics such as revenue, expenses, and profitability. While dashboards provide a snapshot of financial health, they often operate on delayed data. A spike in expenses or a dip in margins may only become visible after reports are generated. By then, the opportunity to act early is lost. The typical workflow involves:
- Reviewing dashboards
- Identifying anomalies
- Requesting deeper analysis
- Taking action after validation
This delay affects decision-making speed. With VADY, financial monitoring becomes continuous and intelligent.
The system tracks financial data in real time and automatically detects anomalies. It not only highlights the issue but also explains the underlying drivers such as cost increases in specific categories or unexpected revenue changes. More importantly, VADY provides recommendations, enabling finance teams to take immediate action.
Outcome:
- Real-time financial visibility
- Early detection of risks
- Faster, data-driven decisions
The shift is from reporting performance to actively managing it.
What CXOs Should Ask About Their Dashboards
For CXOs, the real question is not whether dashboards exist but whether they are effective.
Key questions to consider:
- Are teams waiting for insights instead of acting?
- Are decisions delayed due to manual analysis?
- Are dashboards being used regularly—or ignored?
- Are insights arriving too late to matter?
If the answer to these questions is yes, the issue is not data. It is the system.
Conclusion: Visibility Is Not Enough
Dashboards have played an important role in making data accessible. But they are no longer sufficient. Because business problems are not solved by seeing data. They are solved by acting on it. Enterprises that rely only on dashboards will continue to face delays, confusion, and dependency. Those that move toward intelligent, action-driven systems will operate faster, smarter, and more effectively.
At NewFangled Vision, this shift is already underway. Organizations are moving beyond dashboards toward systems that deliver real-time insights, recommendations, and actions. Because in the end, the goal is not to visualize data. It is to make better decisions faster.
![]()
I work at NewFangled Vision, a 6-year-old private GenAI startup from India. We build enterprise-grade AI systems without large LLMs or heavy GPU dependence, with a mission to make AI a seamless, must-have capability for every organization—without complexity or hassle.